 Bitcoin
  Ethereum
  Tether
  XRP
XRP  BNB
BNB  USDC
USDC  Solana
  TRON
TRON  Figure Heloc
  Dogecoin
  WhiteBIT Coin
  USDS
USDS  Hyperliquid
  Cardano
  Wrapped stETH
  LEO Token
  Bitcoin Cash
  Wrapped Bitcoin
  Zcash
Zcash  Binance Bridged USDT (BNB Smart Chain)
  Toncoin
  Canton
  Wrapped eETH
  Stellar
  MemeCore
  USD1
USD1  sUSDS
sUSDS  Litecoin
  Coinbase Wrapped BTC
  Avalanche
  Sui
Sui  Hedera
  WETH
WETH  Ethena USDe
  Shiba Inu
  USDT0
USDT0  Circle USYC
  Bittensor
  Global Dollar
  BlackRock USD Institutional Digital Liquidity Fund
  Ethena Staked USDe
  PAX Gold
  Polkadot
  World Liberty Financial
  NEAR Protocol
  Pi Network
  Sky
Sky  OKB
OKB  Falcon USD
  HTX DAO
  Aster
Aster  syrupUSDC
  Pepe
Pepe  Ondo
Ondo  Ripple USD
  USDD
USDD  Aave
Aave  Ondo US Dollar Yield
  BFUSD
BFUSD  Janus Henderson Anemoy Treasury Fund
  KuCoin
  Ethena
  Jupiter Perpetuals Liquidity Provider Token
  Algorand
  POL (ex-MATIC)
  Superstate Short Duration U.S. Government Securities Fund (USTB)
  Quant
Quant  Jito Staked SOL
  Render
  Spiko EU T-Bills Money Market Fund
  Cosmos Hub
  Binance-Peg WETH
  Rocket Pool ETH
  NEXO
NEXO  Filecoin
  Binance Bridged USDC (BNB Smart Chain)
  Worldcoin
  Gate
Gate  Aptos
Aptos  Function FBTC
  Arbitrum
  Stable
  SkyAI
SkyAI  Pump.fun
  JUST
JUST  syrupUSDT
  Pudgy Penguins
  Flare
Flare  VeChain
  Binance Staked SOL
  Jupiter
  USDtb
USDtb  Beldex
  OUSG
OUSG  NEW X CEO IS BACK
  Polygon Bridged USDC (Polygon PoS)
  Bonk
Bonk  Solv Protocol BTC
  Siren
Siren  Virtuals Protocol
  clBTC
clBTC  Venice Token
  Usual USD
  MegaUSD
  Official Trump
  Midnight
  YLDS
YLDS  StakeWise Staked ETH
  Terra Luna Classic
  Kinetiq Staked HYPE
  tBTC
tBTC  Artificial Superintelligence Alliance
  WrappedM by M0
  TrueUSD
  A7A5
A7A5  edgeX
edgeX  Chiliz
  EURC
EURC  c8ntinuum
  Aerodrome Finance
  Mantle Staked Ether
  Polygon PoS Bridged DAI (Polygon POS)
  ADI
ADI  COCA
COCA  Janus Henderson Anemoy AAA CLO Fund
  SPX6900
  Injective
  Liquid Staked ETH
  Sun Token
  Arbitrum Bridged WBTC (Arbitrum One)
  Monad
Monad  Curve DAO
  LayerZero
  Wrapped Flare
  Ether.fi
  Humanity
  L2 Standard Bridged WETH (Base)
  Kinesis Gold
  Steakhouse USDC Morpho Vault
  Celestia
  Decred
  币安人生 (BinanceLife)
  USDGO
USDGO  Unibase
  Binance-Peg XRP
  Ether.Fi Liquid ETH
  LAB
LAB  BUILDon
  Zebec Network
  Noon
Noon  Lido DAO
  DoubleZero
  Jupiter Staked SOL
  Conflux
  Savings USDD
  Bitcoin SV
  PRIME
PRIME  FLOKI
FLOKI  Marinade Staked SOL
  AINFT
AINFT  Arbitrum Bridged WETH (Arbitrum One)
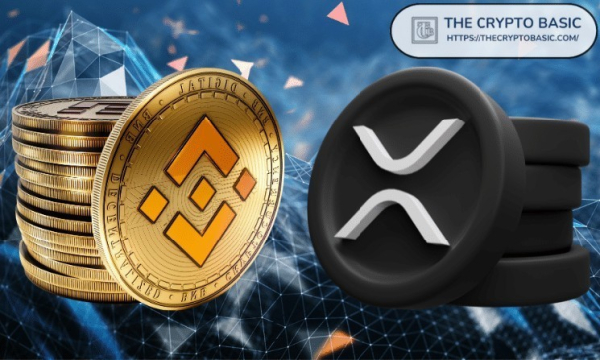

A well-known market strategist believes XRP is currently following the path set out by BNB amid the rally to $1,000.
Notably, XRP has slipped back under the $3 mark as the broader crypto market faces new downward pressure. The drop has made traders cautious, as they watch to see if the token will hold its next support levels.
However, despite this short-term weakness, some analysts believe XRP could soon follow BNB’s recent breakout and set up for a rally well above $5. Specifically, Charting Guy recently compared the price charts of BNB and XRP and pointed out some interesting similarities.
However, when the bullish momentum finally returned, confirmed by a bullish crossover on the weekly oscillator, BNB broke out of the range in July 2025 and hit a fresh all-time high above $1,000, reaching $1,082 before facing new resistance.
XRP Following the Same Pattern
Interestingly, XRP’s daily chart shows the same setup. Specifically, since late 2024, following its breakout from the $0.5 level, XRP has trended lower under a descending resistance line while holding firm around $2 support.
In July 2025, it broke the trendline and rallied past $3.6 before stalling in a sideways box between roughly $2.7 and $3.6. XRP has maintained a price action within this box for nearly two months.
BNB 1W Chart and XRP 1D Chart | Charting Guy
However, the daily oscillator has now flashed a bullish crossover, almost identical to the one that triggered BNB’s breakout earlier this year. XRP currently trades around $2.9, but Charting Guy’s charts indicate that it might be placing itself at the same stage BNB was in before its surge.
The resemblance between the two charts is hard to ignore. Specifically, both assets show the same sequence: a steep decline from highs, multiple tests of a flat base, a breakout from a falling resistance line, a sharp spike, and a consolidation phase inside a rectangle.
For BNB, this structure ended with a breakout to record levels above the $1,000 price milestone. If XRP repeats the script, a move above $5 could be next, also marking a new all-time high.
XRP Short-Term and Long-Term Outlooks
Despite this promising outlook, XRP’s short-term price action is shaky. EGRAG Crypto recently warned that the 50-day EMA is on track to meet XRP around $2.77. He said a clean break below that level could send the token lower, with $2.65 standing as the most important support for the next bull run.
#XRP Update: 3-Day Time Frame 🔍:
👉It looks like the 50 EMA is on track to meet #XRP around $2.77. If we break through this target, we could see further downside, which isn’t what we want to hear! 😬
👉I know you might be tired of hearing me stating $2.65, but this level… https://t.co/sOw3oVDAAz pic.twitter.com/aFiH4INOcv
— EGRAG CRYPTO (@egragcrypto) September 22, 2025
Meanwhile, DustyBC also urged caution, pointing out that XRP’s recent swings have lacked conviction. He noted the token rallied briefly after the FOMC meeting but then dropped again, leaving it stuck in sideways action.
XRP 4h Chart | DustyBC
He stressed that XRP must hold above the 200-day EMA, since a fall below it would show that recent rallies were only fakeouts.
On the other hand, long-term projections remain far more bullish. Analyst AllInCrypto has a target of $19.20 for XRP, arguing that the bigger trend still points higher once market momentum turns.
🚨 📈 A look at $XRP’s recent movements and where we could expect to see the token going, closer towards our long-term price target of $19.20 pic.twitter.com/wEEM4CFPLs
— ALLINCRYPTO (@RealAllinCrypto) September 21, 2025