 Bitcoin
  Ethereum
  Tether
  XRP
XRP  BNB
BNB  USDC
USDC  Solana
  TRON
TRON  Figure Heloc
  Dogecoin
  WhiteBIT Coin
  USDS
USDS  Hyperliquid
  LEO Token
  Wrapped stETH
  Cardano
  Bitcoin Cash
  Wrapped Bitcoin
  Binance Bridged USDT (BNB Smart Chain)
  Zcash
Zcash  Canton
  Stellar
  Wrapped eETH
  USD1
USD1  sUSDS
sUSDS  Litecoin
  MemeCore
  Avalanche
  Coinbase Wrapped BTC
  Ethena USDe
  Hedera
  Shiba Inu
  WETH
WETH  Sui
Sui  Toncoin
  USDT0
USDT0  Circle USYC
  Bittensor
  Global Dollar
  BlackRock USD Institutional Digital Liquidity Fund
  Ethena Staked USDe
  PAX Gold
  Polkadot
  Sky
Sky  Pi Network
  Falcon USD
  World Liberty Financial
  OKB
OKB  Aster
Aster  NEAR Protocol
  HTX DAO
  syrupUSDC
  Pepe
Pepe  Ripple USD
  USDD
USDD  Aave
Aave  Ondo
Ondo  Ondo US Dollar Yield
  BFUSD
BFUSD  Janus Henderson Anemoy Treasury Fund
  KuCoin
  POL (ex-MATIC)
  Jupiter Perpetuals Liquidity Provider Token
  Quant
Quant  Superstate Short Duration U.S. Government Securities Fund (USTB)
  Spiko EU T-Bills Money Market Fund
  Jito Staked SOL
  Algorand
  Cosmos Hub
  NEXO
NEXO  Binance-Peg WETH
  Ethena
  Rocket Pool ETH
  Render
  Gate
Gate  Binance Bridged USDC (BNB Smart Chain)
  Aptos
Aptos  Worldcoin
  Arbitrum
  Function FBTC
  Stable
  JUST
JUST  Filecoin
  Pump.fun
  Flare
Flare  syrupUSDT
  Pudgy Penguins
  Beldex
  VeChain
  Binance Staked SOL
  OUSG
OUSG  Jupiter
  USDtb
USDtb  NEW X CEO IS BACK
  Polygon Bridged USDC (Polygon PoS)
  Usual USD
  Solv Protocol BTC
  Bonk
Bonk  Official Trump
  YLDS
YLDS  Midnight
  clBTC
clBTC  Siren
Siren  TrueUSD
  A7A5
A7A5  SkyAI
SkyAI  StakeWise Staked ETH
  Virtuals Protocol
  Kinetiq Staked HYPE
  MegaUSD
  tBTC
tBTC  Artificial Superintelligence Alliance
  WrappedM by M0
  Terra Luna Classic
  EURC
EURC  edgeX
edgeX  Chiliz
  Venice Token
  Aerodrome Finance
  c8ntinuum
  ADI
ADI  Mantle Staked Ether
  Unibase
  Polygon PoS Bridged DAI (Polygon POS)
  Janus Henderson Anemoy AAA CLO Fund
  COCA
COCA  币安人生 (BinanceLife)
  Liquid Staked ETH
  Arbitrum Bridged WBTC (Arbitrum One)
  Injective
  Manadia
  Monad
Monad  Wrapped Flare
  Kinesis Gold
  Sun Token
  L2 Standard Bridged WETH (Base)
  Curve DAO
  Steakhouse USDC Morpho Vault
  LayerZero
  SPX6900
  Humanity
  Ether.fi
  Celestia
  Binance-Peg XRP
  Decred
  Ether.Fi Liquid ETH
  BUILDon
  PRIME
PRIME  Lido DAO
  Noon
Noon  Bitcoin SV
  Conflux
  Jupiter Staked SOL
  FLOKI
FLOKI  Savings USDD
  AINFT
AINFT  Zebec Network
  USDGO
USDGO  Marinade Staked SOL
  crvUSD
  Arbitrum Bridged WETH (Arbitrum One)
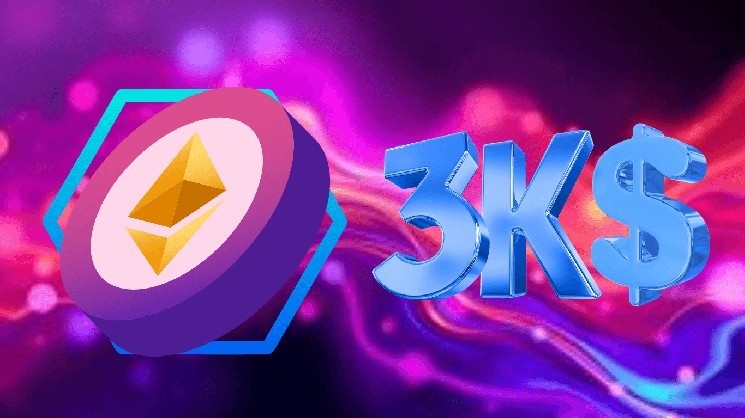

Ethereum price is once again at a crucial crossroads. After weeks of consolidation, ETH price is showing signs of renewed momentum. Traders and investors are now watching closely as the price edges above key resistance levels, hinting at a potential breakout. With Bitcoin stabilizing and altcoins gaining traction, Ethereum’s price action this week could define its path for the rest of June. But will it really break above $3,000—or is this another bull trap?
Ethereum Price Prediction: What’s Happening on the Daily Chart?

ETH/USD 1 Day Chart- TradingView
Ethereum (ETH) price has shown resilience after bouncing back from its May low and is currently trading around $2,591. On the daily chart, we observe a healthy recovery trend, but ETH is still wrestling with resistance near the 200-day SMA at $2,632. The recent Heikin Ashi candle formation is green and gaining body length again—an early sign of bullish reversal momentum resuming.
The daily 20 SMA ($2,591) is now crossing above the 50 SMA ($2,402), which often indicates a medium-term bullish crossover. This is crucial because it shows that Ethereum is no longer in a bearish compression pattern. The consolidation that lasted most of June appears to be ending, with ETH holding key support above $2,500 and attempting a breakout.
Hourly Chart Hints at a Short-Term Surge

ETH/USD 1 Hr Chart- TradingView
Zooming into the hourly chart, ETH price recently broke above a tight MA ribbon cluster of 20, 50, 100, and 200 SMAs. These were compressing around the $2,550–$2,580 range, which now acts as strong support. The hourly Heikin Ashi candles show consistent green candles, suggesting intraday momentum is clearly on the upside.
Fibonacci retracement and extension levels placed on the hourly chart show the next key resistance zones at $2,780, $2,910, and $3,080. Ethereum has already cleared the 0.236 retracement zone and is attempting to close above the 0.382 level. A clean break and hourly candle close above $2,650 could send ETH toward $2,780 rapidly.
How Strong Is the Current Uptrend?
The Moving Average Ribbon breakout is a classic setup. When Ethereum price moves above the 20-200 SMA band with confirmation, it often marks a trend shift. If we apply a Fibonacci extension from the May low ($2,050) to the June high ($3,140), the 1.618 target level lies near $3,850.
Let’s calculate ETH’s breakout potential:
If ETH price holds above $2,600 and rallies to just the 0.618 level (~$2,910), that’s:
($2,910 – $2,600) / $2,600 × 100 = 11.92% upside.
If we target the 1.0 Fibonacci extension level at $3,140:
($3,140 – $2,600) / $2,600 × 100 = 20.77% upside.
This makes Ethereum’s risk-reward setup very attractive for swing traders if $2,550 holds.
Can Ethereum Hit $3,000 Again?
Yes—but only if it maintains daily closes above $2,620 this week. That level is acting as the neckline of a mini W-shaped double bottom on the hourly and 4H charts. If ETH price clears the $2,780 resistance (marked by the 0.5 Fibonacci level), the next rally could target $3,000 psychologically and then $3,140 structurally.
What’s the Worst-Case Scenario?
If Ethereum price fails to hold $2,550 support, it could retest the $2,400 zone. This would invalidate the breakout setup, and short-term sentiment may flip bearish again. However, the strong confluence of moving averages at $2,567–$2,582 should act as a strong demand zone.
Ethereum Price Prediction: What’s Next?
- Short-term (1–3 days): ETH price likely retests $2,780 if $2,620 holds
- Medium-term (7–14 days): $3,000 remains the next strong magnet
- If momentum continues: Extension target sits near $3,140–$3,850
Ethereum price is flashing early breakout signals across both hourly and daily timeframes. If it rides above the $2,650 range and breaks past the local resistance zones, we could be looking at a strong rally back toward the $3,000 psychological barrier. Keep an eye on volume, and watch for daily closes above $2,620 to confirm the bullish continuation.
$ETH, $Ethereum