Ethereum’s recent price action reflects a market transitioning from impulsive selling into a potential short-term stabilisation phase. After a sharp decline toward the $1,750 demand zone, $ETH has reacted with a moderate rebound, yet is expected to continue fluctuating in the short term.
Ethereum Price Analysis: The Daily Chart
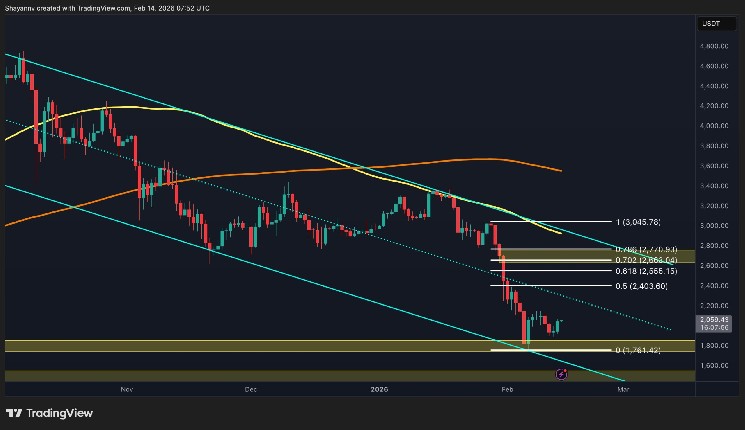
On the daily chart, $ETH continues to trade inside its descending channel, with lower highs and lower lows still intact. The recent impulsive drop pushed the price sharply into the $1.8K demand area, where buyers reacted and triggered a rebound toward the $2.1K region.
However, the asset remains below the 0.5 Fibonacci level at $2.4K and well under the 0.618 level at $2.5K, confirming that the current move is corrective rather than a confirmed trend reversal.
The $2.7K range, aligned with the 0.702–0.786 retracement levels, stands as a major supply zone and would be the key resistance area if a stronger recovery unfolds. As long as $ETH remains below $2.5K, the broader structure favours sellers, while the $1.7K level remains the critical support to hold.
$ETH/USDT 4-Hour Chart
On the 4-hour chart, the price action has formed a short-term contracting structure after the sharp bounce from $1.7K. The market is currently fluctuating between the ascending short-term support trendline and the descending local resistance trendline, compressing near the $2.1K area. A successful break above $2.1K could open the path toward $2.5K, which is the next key resistance.
Conversely, losing the $2K intraday support would likely expose the $1.8K zone again. For now, $ETH appears to be in a short-term consolidation phase between $1.8K and $2.1K following the recent volatility spike.
Sentiment Analysis
The Ethereum Spot Average Order Size chart shows a notable increase in green dots during the recent decline toward the $1.8K region. These green clusters indicate large whale-sized spot orders entering the market as prices traded at low levels. This behaviour suggests potential accumulation by bigger players during the panic-driven sell-off.
While this does not immediately signal a trend reversal, the concentration of whale activity near $1.8K strengthens this zone as a structurally important demand area. If accumulation continues and price stabilises above $2K, the probability of a broader recovery toward higher resistance levels will gradually increase.
 Bitcoin
  Ethereum
  Tether
  BNB
BNB  XRP
XRP  USDC
USDC  Solana
  Figure Heloc
  Dogecoin
  USDS
USDS  WhiteBIT Coin
  Bitcoin Cash
  LEO Token
  Wrapped stETH
  Cardano
  Hyperliquid
  Wrapped Bitcoin
  Binance Bridged USDT (BNB Smart Chain)
  Ethena USDe
  Stellar
  Canton
  Wrapped eETH
  USD1
USD1  sUSDS
sUSDS  Litecoin
  MemeCore
  Zcash
Zcash  Coinbase Wrapped BTC
  Avalanche
  Hedera
  WETH
WETH  Sui
Sui  Shiba Inu
  USDT0
USDT0  Toncoin
  Bittensor
  World Liberty Financial
  Circle USYC
  PAX Gold
  Ethena Staked USDe
  BlackRock USD Institutional Digital Liquidity Fund
  Polkadot
  Global Dollar
  OKB
OKB  Pi Network
  Falcon USD
  Sky
Sky  Aster
Aster  NEAR Protocol
  syrupUSDC
  HTX DAO
  Aave
Aave  Pepe
Pepe  Ondo
Ondo  BFUSD
BFUSD  Ondo US Dollar Yield
  Ripple USD
  Janus Henderson Anemoy Treasury Fund
  Gate
Gate  USDD
USDD  KuCoin
  Quant
Quant  Jupiter Perpetuals Liquidity Provider Token
  Pump.fun
  POL (ex-MATIC)
  Render
  Spiko EU T-Bills Money Market Fund
  Algorand
  Jito Staked SOL
  Worldcoin
  NEXO
NEXO  Binance-Peg WETH
  Cosmos Hub
  Rocket Pool ETH
  USDtb
USDtb  Superstate Short Duration U.S. Government Securities Fund (USTB)
  Binance Bridged USDC (BNB Smart Chain)
  Ethena
  Midnight
  Aptos
Aptos  Function FBTC
  Official Trump
  Flare
Flare  Filecoin
  syrupUSDT
  OUSG
OUSG  Stable
  Beldex
  Binance Staked SOL
  YLDS
YLDS  VeChain
  Jupiter
  Arbitrum
  Usual USD
  NEW X CEO IS BACK
  Polygon Bridged USDC (Polygon PoS)
  Artificial Superintelligence Alliance
  Solv Protocol BTC
  JUST
JUST  Bonk
Bonk  TrueUSD
  clBTC
clBTC  A7A5
A7A5  LayerZero
  Fasttoken
  Virtuals Protocol
  Chiliz
  StakeWise Staked ETH
  Pudgy Penguins
  EURC
EURC  Kinetiq Staked HYPE
  tBTC
tBTC  Janus Henderson Anemoy AAA CLO Fund
  WrappedM by M0
  Ether.fi
  PRIME
PRIME  c8ntinuum
  Kinesis Gold
  Mantle Staked Ether
  Decred
  Polygon PoS Bridged DAI (Polygon POS)
  Sun Token
  ADI
ADI  COCA
COCA  Curve DAO
  AINFT
AINFT  Liquid Staked ETH
  Venice Token
  Arbitrum Bridged WBTC (Arbitrum One)
  USDai
USDai  River
River  Aerodrome Finance
  Wrapped Flare
  Injective
  Lido DAO
  L2 Standard Bridged WETH (Base)
  Bitcoin SV
  Steakhouse USDC Morpho Vault
  Conflux
  Kaia
Kaia  Kinesis Silver
  DoubleZero
  FLOKI
FLOKI  Binance-Peg XRP
  Legacy Frax Dollar
  Ether.Fi Liquid ETH
  Celestia
  JasmyCoin
  Noon
Noon  Monad
Monad  Official FO
  The Graph
  Jupiter Staked SOL
  crvUSD
  Savings USDD
  SPX6900
  Ape and Pepe
  Olympus
  Marinade Staked SOL
  IOTA
IOTA  Arbitrum Bridged WETH (Arbitrum One)