 Bitcoin
  Ethereum
  Tether
  BNB
BNB  XRP
XRP  USDC
USDC  Solana
  TRON
TRON  Figure Heloc
  Dogecoin
  WhiteBIT Coin
  USDS
USDS  Hyperliquid
  Cardano
  Wrapped stETH
  LEO Token
  Zcash
Zcash  Wrapped Bitcoin
  Bitcoin Cash
  Binance Bridged USDT (BNB Smart Chain)
  Toncoin
  Canton
  Wrapped eETH
  Stellar
  MemeCore
  USD1
USD1  sUSDS
sUSDS  Litecoin
  Coinbase Wrapped BTC
  Avalanche
  Ethena USDe
  Hedera
  WETH
WETH  Sui
Sui  Shiba Inu
  USDT0
USDT0  Circle USYC
  Bittensor
  Global Dollar
  BlackRock USD Institutional Digital Liquidity Fund
  Ethena Staked USDe
  World Liberty Financial
  PAX Gold
  Polkadot
  NEAR Protocol
  Sky
Sky  Pi Network
  OKB
OKB  Falcon USD
  HTX DAO
  Ondo
Ondo  syrupUSDC
  Pepe
Pepe  Aster
Aster  Ripple USD
  USDD
USDD  Aave
Aave  Ondo US Dollar Yield
  BFUSD
BFUSD  Janus Henderson Anemoy Treasury Fund
  Algorand
  KuCoin
  Jupiter Perpetuals Liquidity Provider Token
  Ethena
  POL (ex-MATIC)
  Superstate Short Duration U.S. Government Securities Fund (USTB)
  Render
  Jito Staked SOL
  Quant
Quant  Spiko EU T-Bills Money Market Fund
  Binance-Peg WETH
  Cosmos Hub
  Rocket Pool ETH
  NEXO
NEXO  Worldcoin
  Binance Bridged USDC (BNB Smart Chain)
  Filecoin
  Gate
Gate  Aptos
Aptos  Function FBTC
  Arbitrum
  Stable
  JUST
JUST  Siren
Siren  Pump.fun
  syrupUSDT
  Jupiter
  VeChain
  Flare
Flare  Binance Staked SOL
  Pudgy Penguins
  USDtb
USDtb  SkyAI
SkyAI  Beldex
  OUSG
OUSG  NEW X CEO IS BACK
  Polygon Bridged USDC (Polygon PoS)
  Bonk
Bonk  Solv Protocol BTC
  Virtuals Protocol
  clBTC
clBTC  Venice Token
  Usual USD
  Official Trump
  YLDS
YLDS  MegaUSD
  StakeWise Staked ETH
  Midnight
  Terra Luna Classic
  Kinetiq Staked HYPE
  A7A5
A7A5  tBTC
tBTC  Artificial Superintelligence Alliance
  WrappedM by M0
  TrueUSD
  edgeX
edgeX  Chiliz
  EURC
EURC  c8ntinuum
  Aerodrome Finance
  Mantle Staked Ether
  ADI
ADI  Polygon PoS Bridged DAI (Polygon POS)
  COCA
COCA  Janus Henderson Anemoy AAA CLO Fund
  USDGO
USDGO  SPX6900
  Liquid Staked ETH
  Sun Token
  Arbitrum Bridged WBTC (Arbitrum One)
  Injective
  Monad
Monad  Humanity
  Wrapped Flare
  LayerZero
  Curve DAO
  L2 Standard Bridged WETH (Base)
  Steakhouse USDC Morpho Vault
  币安人生 (BinanceLife)
  Kinesis Gold
  Ether.fi
  Decred
  Binance-Peg XRP
  Celestia
  Ether.Fi Liquid ETH
  BUILDon
  FLOKI
FLOKI  Conflux
  Noon
Noon  apxUSD
  PRIME
PRIME  Bitcoin SV
  Jupiter Staked SOL
  Savings USDD
  Zebec Network
  Lido DAO
  Unibase
  Marinade Staked SOL
  AINFT
AINFT  Arbitrum Bridged WETH (Arbitrum One)
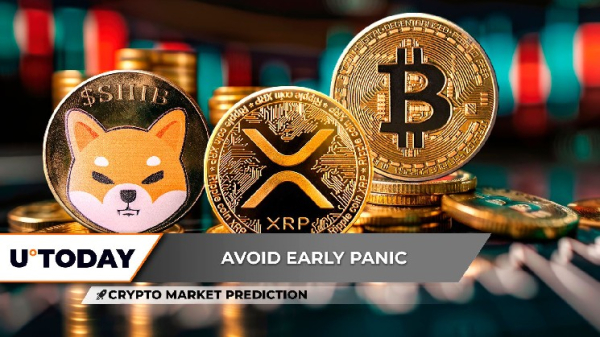
Crypto Market Prediction: Shiba Inu (SHIB) to Hit 2025’s Bottom, XRP: Hope for $3 Recovery Not Lost, Bitcoin Not Losing $100,000, Yet – U.Today
 to Hit 2025's Bottom, XRP: Hope for $3 Recovery Not Lost, Bitcoin Not Losing $100,000, Yet - U.Today")
The market has entered a long-term correction period and might lose a serious portion of its valuation. Shiba Inu is getting ready to test out 2025’s bottom at around $0.00001, and Bitcoin is already eyeing $100,000 level. But in the case of Bitcoin and XRP, the correction might not aggravate and keep the overall state of the market neutral.
Shiba Inu weak
There are indications of weakness on Shiba Inu, which could push the token down to its lowest levels in 2025. The asset’s recent break from its long-standing symmetrical triangle structure has put it in a technical position, indicating that more losses are probably next. The 200-day EMA is still acting as strong overhead resistance, and SHIB has dropped below both its 50-day and 100-day moving averages, currently trading at about $0.00001213.
 to Hit 2025's Bottom, XRP: Hope for $3 Recovery Not Lost, Bitcoin Not Losing $100,000, Yet - U.Today")
The failure to stay above these levels indicates that buyers are losing market control and that bearish momentum is developing. The sell-offs, volume spikes, provide additional evidence that this decline is the result of a wider change in market sentiment rather than just a low liquidity event. With little indication of a reversal, the RSI has fallen near oversold territory, indicating intense selling pressure.
The most likely scenario going forward is a test of deeper levels of support. The next critical area is around $0.00001050, which might represent a new local bottom for 2025 if SHIB is unable to stabilize above $0.00001200. The possibility of SHIB starting a protracted downward trend, and possibly wiping out a large portion of its previous annual gains, would be indicated by a break below this level.
The outlook for SHIB remains pessimistic, due to the lack of significant catalysts in the near future and cautious market conditions. In the coming weeks, Shiba Inu looks set to revisit, or even set, its lowest price of 2025, unless there is a significant resurgence in buying interest or a significant shift in the general sentiment toward cryptocurrencies.
XRP: Things are not so bad
With XRP falling below its most recent support, traders are worried that the asset might be headed for even more declines. Although a breakdown is suggested by the drop below the descending resistance line, the situation may not be as clear-cut as it seems. Notwithstanding the technical flaw, a number of indicators suggest that the breakdown might be a hoax, which would allow for a speedy recovery.
XRP is currently trading close to $2.86, touching levels around the 100-day EMA, which frequently serves as strong support in trending markets, and falling below the 50-day EMA. The absence of notable exchange inflows indicates that major holders are not in a rush to sell off tokens, despite the fact that this move initially appears bearish. This lack of panic selling is a crucial indicator that the market might still level off.
 to Hit 2025's Bottom, XRP: Hope for $3 Recovery Not Lost, Bitcoin Not Losing $100,000, Yet - U.Today")
Volume should also be taken into account. Even though selling pressure caused XRP to crash, the activity spike was not as severe as it has been in the past during liquidation events. This gives rise to the possibility that long-term holders are still in a position to recover, while short-term traders may have been flushed out. The $2.80-$2.85 range will be critical in the future.
The token may return to its previous trading channel if XRP can swiftly regain the $2.95-$3.00 range. But failing to do so puts the market at risk of retesting deeper supports close to $2.60. Although it should not be interpreted as a clear indication of collapse, the breakdown should be handled carefully for the time being.
Bitcoin backpedaling
At $112,916, Bitcoin is clearly weak after recently retreating from the $115,000-$116,000 range. Traders are worried that the top cryptocurrency may lose its six-digit psychological threshold of $100,000 as a result of the correction. However, that risk is still far off for the time being.
BTC is consolidating on the daily chart near $111,800, just above the 100-day EMA, while the 200-day EMA is much lower at about $105,000. It would be premature to worry about a collapse below $100,000 unless Bitcoin makes a clear break below this level, which serves as a crucial long-term support zone. The difference between the 200 EMA and the current price levels indicates that Bitcoin has a significant amount of room to withstand volatility before any existential downside risks materialize.
The fact that volume has decreased during this decline suggests that there may not be strong conviction behind the selling pressure. In addition, the Relative Strength Index (RSI) has cooled, hovering around 45, indicating that Bitcoin is neither overbought nor oversold. Instead of a sudden decline, this neutral momentum suggests a possible stabilization. However, the overall technical setup does have a bearish bias.
After failing to reach new highs, the market is waning, and Bitcoin might continue to face pressure as altcoins also exhibit weakness. With the 200 EMA at $105,000 serving as the make-or-break level to monitor, a further decline toward $108,000-$106,000 will put investor confidence to the test.
All things considered, Bitcoin is losing ground but is not yet in danger of crossing the $100,000 threshold. At $105,000, the structural support offers a sizable buffer. The discussion will only turn to Bitcoin losing six figures if this level fails; this is still a possibility, but not the current situation.